Home
Recent
2022.01.03 Our new CAVE-type display, an ActiveCube by Virtalis, is now fully installed and working in the Appenzeller Visualization Laboratory
Projects
Incoporating Uncertainy in the Visualization Process
 Various different sources of uncertainty exist in the data
capture and visualization process. These can result from the
capture technology or noise during the data capture process.
Within the data processing and visualization pipeline these
uncertainties are carried forward and sometimes amplified. Hence,
methods for properly handling these uncertainties and conveying
uncertainties properly and accurately to the user within the
visualization. The goal of this project is to develop proper
techniques for handling these uncertainties and devising
visualization approaches that allow the user to easily recognize
any uncertainties present in the data.
J21
J22
J23
J26
J27
P26
P34
P42
Various different sources of uncertainty exist in the data
capture and visualization process. These can result from the
capture technology or noise during the data capture process.
Within the data processing and visualization pipeline these
uncertainties are carried forward and sometimes amplified. Hence,
methods for properly handling these uncertainties and conveying
uncertainties properly and accurately to the user within the
visualization. The goal of this project is to develop proper
techniques for handling these uncertainties and devising
visualization approaches that allow the user to easily recognize
any uncertainties present in the data.
J21
J22
J23
J26
J27
P26
P34
P42
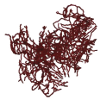
Analysis of Molecular Structures
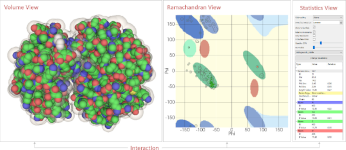 In order to better understand molecular structures, better
visualization and analysis tools are needed. When capturing the
geometric properties of molecular structures, a variety of
uncertainties are inherent in these geometric models. These
uncertainties stem from the capturing methods but also
physical properties of the individual atoms involved.
Visualization methods that incorporate these levels of
uncertainties are imperative for a proper analysis.
J27
In order to better understand molecular structures, better
visualization and analysis tools are needed. When capturing the
geometric properties of molecular structures, a variety of
uncertainties are inherent in these geometric models. These
uncertainties stem from the capturing methods but also
physical properties of the individual atoms involved.
Visualization methods that incorporate these levels of
uncertainties are imperative for a proper analysis.
J27
Enhanced Reconstruction Methods for 3D Scanning Technologies
 3D capture technologies commonly used in the medical domain, such as
CT or MRI, can sometimes suffer from inaccuracies resulting from the
tissue they are designed to capture. For example, calcifications are
known to be overestimated in size and mass in CT scans. More advanced
techniques are needed to more accurately reconstruct the 3D data from
the orginal signal.
J25
3D capture technologies commonly used in the medical domain, such as
CT or MRI, can sometimes suffer from inaccuracies resulting from the
tissue they are designed to capture. For example, calcifications are
known to be overestimated in size and mass in CT scans. More advanced
techniques are needed to more accurately reconstruct the 3D data from
the orginal signal.
J25
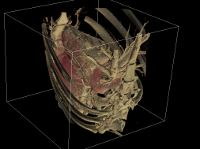
Enhanced Nursing Training using Augmented Reality
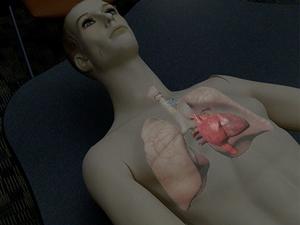 Augmented and virtual reality can be a great tool to support
various training methods as they can provide more insight and
thus enhance the learning process resulting in faster learning
and more in depth understanding. In this application, animated
models of the lungs and heart are componied by the ribs and
digestive tract. Different sounds can further enhance the
augmented reality experience. Perliminary data has already
shown that there is an improvement in the learning process when
comparing students using the augmented reality versus students
trainged using the traditional approach.
P43
C42
I9
Augmented and virtual reality can be a great tool to support
various training methods as they can provide more insight and
thus enhance the learning process resulting in faster learning
and more in depth understanding. In this application, animated
models of the lungs and heart are componied by the ribs and
digestive tract. Different sounds can further enhance the
augmented reality experience. Perliminary data has already
shown that there is an improvement in the learning process when
comparing students using the augmented reality versus students
trainged using the traditional approach.
P43
C42
I9
Augmented Reality support for Surgery
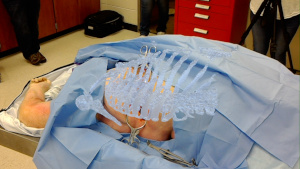 Augmented reality can be used to support surgeons to increase
precision and thereby reduce the invasiveness of the surgery by
using smaller incisions. This requires a direct view of internal
structures, such as organs or bones, through the scin. Using
augmented reality devices, such as the Microsoft Hololens or
Magic Leap One, such a view can be provided while not restricting
the surgeon and leaving boths hands free due to the fact that these
devices are head-mounted and can be controlled by gestures and voice.
The models used in the overlay are patient-specific based on a CT
scan of that patient. Preliminary cadaver testing has shown very
high accuracy in the overlay with a high degree of alignment
discorverd between rib structures and the overlaid image after
making the incision.
C42
C43
Augmented reality can be used to support surgeons to increase
precision and thereby reduce the invasiveness of the surgery by
using smaller incisions. This requires a direct view of internal
structures, such as organs or bones, through the scin. Using
augmented reality devices, such as the Microsoft Hololens or
Magic Leap One, such a view can be provided while not restricting
the surgeon and leaving boths hands free due to the fact that these
devices are head-mounted and can be controlled by gestures and voice.
The models used in the overlay are patient-specific based on a CT
scan of that patient. Preliminary cadaver testing has shown very
high accuracy in the overlay with a high degree of alignment
discorverd between rib structures and the overlaid image after
making the incision.
C42
C43
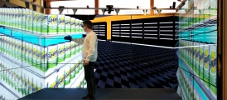
Efficient Learning Through Virtual and Augmented Reality Techniques
 Virtual environments are well-known for improving the learning experience
in certain applications. If done properly, retention rate can be increased
and the learning can become more effective by reducing the time it takes for
someone to learn specific topics. At the same time, virtual and augmented
reality technologies can provide a safer learning environment. Participating
areas include Engineering, Computer Science, Nursing, Medical, Architecure,
and Manufacturing.
C41
P43
Virtual environments are well-known for improving the learning experience
in certain applications. If done properly, retention rate can be increased
and the learning can become more effective by reducing the time it takes for
someone to learn specific topics. At the same time, virtual and augmented
reality technologies can provide a safer learning environment. Participating
areas include Engineering, Computer Science, Nursing, Medical, Architecure,
and Manufacturing.
C41
P43
Interactive Analysis of Design Prototypes Using Virtual Reality
 Using a virtual environment for testing different designs can
provide various different advantages, such as reproducibility
and repeatability. This project utilizes one of our VR
environments to study different designs and compare them to each
other by exposing different study participants to these designs.
J20
Using a virtual environment for testing different designs can
provide various different advantages, such as reproducibility
and repeatability. This project utilizes one of our VR
environments to study different designs and compare them to each
other by exposing different study participants to these designs.
J20
Using Containter Technology for Data Anlytics and Visualization in HPC environments
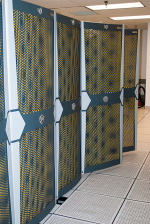 High-performance computing systems can pose different
challenges for data analysis based on the environment they are
run in. For example, restricted environments with enhanced data
security may not allow users to install any type of software
themselves. A workaround can be to use container
technologies. This project studies different container
technologies with respect to their suitability for data
analytics and visualization under those security restrictions.
High-performance computing systems can pose different
challenges for data analysis based on the environment they are
run in. For example, restricted environments with enhanced data
security may not allow users to install any type of software
themselves. A workaround can be to use container
technologies. This project studies different container
technologies with respect to their suitability for data
analytics and visualization under those security restrictions.
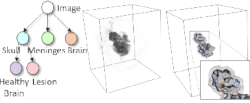
Uncertainty-aware Medical Image Segmentation and Processing
 Processing medical imagery can be a challenging task. Different
artifacts typically present in volumetric scans, such as CT or
MRI, can make selecting specific regions within the image
difficult even for an expert. This project's goals are to
develop image segmentation and processing algorithms that are
aware of uncertainties present in the raw data and provide more
intuitive algorithms to enable the domain experts to
interactively process their data.
P25,
P26,
J23
.
Processing medical imagery can be a challenging task. Different
artifacts typically present in volumetric scans, such as CT or
MRI, can make selecting specific regions within the image
difficult even for an expert. This project's goals are to
develop image segmentation and processing algorithms that are
aware of uncertainties present in the raw data and provide more
intuitive algorithms to enable the domain experts to
interactively process their data.
P25,
P26,
J23
.
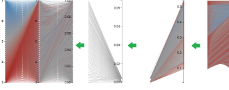
Visual Flow Tracking in Networks
![]() To assist network analysts in their tasks, as part of this project an
interactive visualization system to review simulated
Software-defined networking/network (SDN) data.
overview of the SDN hierarchy and the flow of its packets is
presented. The system provides a visually guided flow tracking of
selected packets through the SDN. Through a brushing and linking
approach, the system forms an interactive analysis tool that is
successfully applied to a simulated SDN dataset.
P28
To assist network analysts in their tasks, as part of this project an
interactive visualization system to review simulated
Software-defined networking/network (SDN) data.
overview of the SDN hierarchy and the flow of its packets is
presented. The system provides a visually guided flow tracking of
selected packets through the SDN. Through a brushing and linking
approach, the system forms an interactive analysis tool that is
successfully applied to a simulated SDN dataset.
P28
Large-scale Visualization For HPC Platforms
 This project aims at implementing visualization algorithms
directly on the HPC platform to better assist the researchers
performaning large-scale simulations on those computing
systems. To avoid download of these large data sets, which can be
prohibitively costly, the visualizations are generated directly on
the HPC system. The implementation takes advantage of the parallel
compute capabilities available on the HPC platform to achieve
better run-time performance. Current implementations include
parallel coordinate plots but could be extended to other
algorithms as well.
J18
This project aims at implementing visualization algorithms
directly on the HPC platform to better assist the researchers
performaning large-scale simulations on those computing
systems. To avoid download of these large data sets, which can be
prohibitively costly, the visualizations are generated directly on
the HPC system. The implementation takes advantage of the parallel
compute capabilities available on the HPC platform to achieve
better run-time performance. Current implementations include
parallel coordinate plots but could be extended to other
algorithms as well.
J18
Visualization of Large-Scale Multidimensional Data
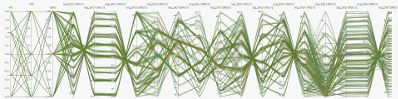 Multidimensional data can be challenging in terms of identifying a
comprehensible, easy-to-interpret visualization. Data sources,
such as general recognition theory, can generate millions of
these multidimensional data sets that need to be visualized all
at the same time. The sample image shows a parallel coordinate
plot of such a data set.
P19,
C27
Multidimensional data can be challenging in terms of identifying a
comprehensible, easy-to-interpret visualization. Data sources,
such as general recognition theory, can generate millions of
these multidimensional data sets that need to be visualized all
at the same time. The sample image shows a parallel coordinate
plot of such a data set.
P19,
C27
Virtual Environments
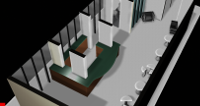 Virtual environments for presenting a specific model, such as an
architectural design, or for repetative testing in which
subjects need to be exposed to a specific scenario can be a valuable tool. In the
latter case it is of upmost importance that the scenario is
exactly identical for every subject. The different displays in
the Appenzeller Visualization
laboratory combined with the available software provide the perfect basis
for these environments.
C25
Virtual environments for presenting a specific model, such as an
architectural design, or for repetative testing in which
subjects need to be exposed to a specific scenario can be a valuable tool. In the
latter case it is of upmost importance that the scenario is
exactly identical for every subject. The different displays in
the Appenzeller Visualization
laboratory combined with the available software provide the perfect basis
for these environments.
C25
Reconstruction of Dragonfly Take-off
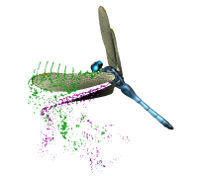 In order to reconstruct and study the flight characteristics of
a dragonfly during take-off, the dragonfly can be captured using
high-speed cameras from different angles to reconstruct the
geometry of the body and wings. Using a flow simulation with
this geometry as boundary condition the air flow around the
wings can be computed and a suitable visualization reveals the
properties that allow the dragonfly at take off.
J12
In order to reconstruct and study the flight characteristics of
a dragonfly during take-off, the dragonfly can be captured using
high-speed cameras from different angles to reconstruct the
geometry of the body and wings. Using a flow simulation with
this geometry as boundary condition the air flow around the
wings can be computed and a suitable visualization reveals the
properties that allow the dragonfly at take off.
J12
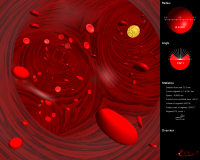
Diffuse Coronary Artery Disease Detection
 The general objective of this project is to develop a novel rationale
for diagnosis of diffuse coronary artery disease (DCAD) using
clinical non-invasive imaging of the coronary arteries. The
indices of diagnosis will be validated in studies of an
atherosclerotic porcine model with DCAD. Our unique algorithms
for accurately extracting morphometric data from computerized
tomography angiography (CTA) images of normal and disease
patients along with our quantative approach uniquely position us
to undertake this research.
J5,J6
The general objective of this project is to develop a novel rationale
for diagnosis of diffuse coronary artery disease (DCAD) using
clinical non-invasive imaging of the coronary arteries. The
indices of diagnosis will be validated in studies of an
atherosclerotic porcine model with DCAD. Our unique algorithms
for accurately extracting morphometric data from computerized
tomography angiography (CTA) images of normal and disease
patients along with our quantative approach uniquely position us
to undertake this research.
J5,J6
Early Lung Disease Detection Alliance
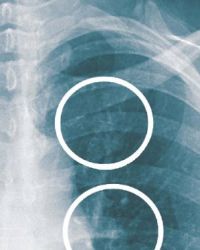 The Cleveland Clinic Foundation and its partners, Riverain Medical,
Wright State University and University Hospitals Health System, have
joined together to form the Early Lung Disease Detection Alliance
(ELDDA), a multidisciplinary research and commercialization program
that will develop, test (through clinical trials), and bring to market
new image-analysis systems that permit the early detection of lung
cancer and other lung diseases. This computer-aided detection (CAD)
system will be applied to the most widely available and used imaging
exam, the chest x-ray. The fight against lung cancer is waged on three
major fronts: prevention, detection and treatment. The goal of this
collaboration is to detect disease at an early stage (i.e. stage I for
lung cancer), a necessary step to improve the treatment and survival
of lung cancer patients and those at risk for lung cancer throughout
Ohio.
J11
The Cleveland Clinic Foundation and its partners, Riverain Medical,
Wright State University and University Hospitals Health System, have
joined together to form the Early Lung Disease Detection Alliance
(ELDDA), a multidisciplinary research and commercialization program
that will develop, test (through clinical trials), and bring to market
new image-analysis systems that permit the early detection of lung
cancer and other lung diseases. This computer-aided detection (CAD)
system will be applied to the most widely available and used imaging
exam, the chest x-ray. The fight against lung cancer is waged on three
major fronts: prevention, detection and treatment. The goal of this
collaboration is to detect disease at an early stage (i.e. stage I for
lung cancer), a necessary step to improve the treatment and survival
of lung cancer patients and those at risk for lung cancer throughout
Ohio.
J11
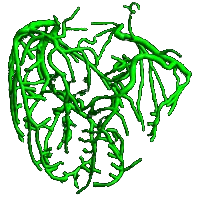
Visualization of vascular structures
 Cardiovascular
diseases, such as atherosclerosis and coronary artery disease, are high
risk factors for cardiac pain and death. We implemented a visualization
software that enables interactive 3-D visualization of the cardiac
vasculature retrieved using CT scanning technology, and an interactive
flight through the vessel. Bifurcation angles and radii of the vessels
can be measured while exploring the tree. Areas of high risk that could
cause potential problems can be identified by this method. The
project is conducted in collaboration with Dr. Ghassan Kassab's lab at
the Department of Biomedical Engineering at the Indiana University Purdue
University, who provided the data set.
P11
Cardiovascular
diseases, such as atherosclerosis and coronary artery disease, are high
risk factors for cardiac pain and death. We implemented a visualization
software that enables interactive 3-D visualization of the cardiac
vasculature retrieved using CT scanning technology, and an interactive
flight through the vessel. Bifurcation angles and radii of the vessels
can be measured while exploring the tree. Areas of high risk that could
cause potential problems can be identified by this method. The
project is conducted in collaboration with Dr. Ghassan Kassab's lab at
the Department of Biomedical Engineering at the Indiana University Purdue
University, who provided the data set.
P11
Large-scale visualization of arterial trees
![]() Current CT scanner allow the retrieval of
vessel only up to a certain point due to the limited resolution. Recent
techniques developed by Benjamin Kaimovitz et al. allow the extension
of such scans down to the vessels at the capillary level, resulting in
a model of the entire arterial vasculature. Of course, such a model is
enormous in size challenging the visualization. We implemented a
visualization software that is capable of handling a model with several
GBs in size, exceeding the main memory of desktop computers. The
software is highly optimized for tree shaped geometrical
objects to achieve the best rendering performance possible.
J3
Current CT scanner allow the retrieval of
vessel only up to a certain point due to the limited resolution. Recent
techniques developed by Benjamin Kaimovitz et al. allow the extension
of such scans down to the vessels at the capillary level, resulting in
a model of the entire arterial vasculature. Of course, such a model is
enormous in size challenging the visualization. We implemented a
visualization software that is capable of handling a model with several
GBs in size, exceeding the main memory of desktop computers. The
software is highly optimized for tree shaped geometrical
objects to achieve the best rendering performance possible.
J3
3D Computer Games
 Computer games are in a sense an example of
virtual environments. In order to facilitate a fully immersive
experience, we developed computer games that support
quad-buffered stereo. Combined with, for example, 3D-capable
displays and active shutter glasses, these games provide a
truely 3D experience. Similarly, existing games and game
engines can be ported to support such 3D capabilities, such as
Cube 2. With Cube 2
being open source, we adapted its game engine to support 3D
stereo. The adapted version can be downloaded, which includes
Windows and Linux binaries, as well as the source code.
C22
Computer games are in a sense an example of
virtual environments. In order to facilitate a fully immersive
experience, we developed computer games that support
quad-buffered stereo. Combined with, for example, 3D-capable
displays and active shutter glasses, these games provide a
truely 3D experience. Similarly, existing games and game
engines can be ported to support such 3D capabilities, such as
Cube 2. With Cube 2
being open source, we adapted its game engine to support 3D
stereo. The adapted version can be downloaded, which includes
Windows and Linux binaries, as well as the source code.
C22
Tensor field visualization
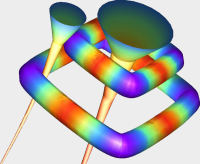 The analysis and visualization of tensor fields
is an advancing area in scientific visualization. Topology based
methods that investigate the eigenvector fields of second order tensor
fields have gained increasing interest in recent years. To complete the
topological analysis, we developed an algorithm for detecting closed
hyper-streamlines as an important topological feature.
BC5
The analysis and visualization of tensor fields
is an advancing area in scientific visualization. Topology based
methods that investigate the eigenvector fields of second order tensor
fields have gained increasing interest in recent years. To complete the
topological analysis, we developed an algorithm for detecting closed
hyper-streamlines as an important topological feature.
BC5
Vector field visualization (FAnToM)
![]() FAnToM (Field Analysis using Topological
Methods) is a software system that allows a user to explore vector
fields by applying different analysis and visualization algorithms.
Among other algorithms, it is capable of analyzing the topology of a
2-D or 3-D vector field, including complex structures, such as closed
streamlines. This greatly helps a user to comprehend the structure of
complex vector fields which could not be achieved by traditional
visualization methods.
P6
FAnToM (Field Analysis using Topological
Methods) is a software system that allows a user to explore vector
fields by applying different analysis and visualization algorithms.
Among other algorithms, it is capable of analyzing the topology of a
2-D or 3-D vector field, including complex structures, such as closed
streamlines. This greatly helps a user to comprehend the structure of
complex vector fields which could not be achieved by traditional
visualization methods.
P6
![]()
©2005-2026
Thomas Wischgoll